Strategy Guides
Backtesting Due Score: How Historical Picks Would Have Performed
Tags: due score, backtesting, methodology
Every LottoIQ strategy guide says the same thing: Due Score doesn't predict, it's four historical signals combined into one ranked number. That's an easy claim to make. This post tests it directly, by rewinding through real draw history and asking, draw by draw, using only the data that existed at that moment: if you had followed Due Score's top picks every single time, how many numbers would you actually have matched?
The Method
This is a walk-forward backtest, not a simulation. For every draw in a game's history (starting once at least 20 prior draws exist), Due Score was computed using only the draws that happened before it, the exact same lambda-selection rule described in How Due Score Actually Works. The top picks (6 numbers, or 7 for Lotto MAX) were then compared against what was actually drawn. No lookahead, no hindsight, no peeking at the answer before making the pick.
Since real LottoIQ members can view Due Score under three different dataset windows, Last 30, Last 90, or All-time, this backtest tests all three, not just one. All-time uses an expanding window (everything known up to that point in history). Last 30 and Last 90 use a trailing window of only the most recent 30 or 90 draws before each pick, mirroring exactly what a member using those dataset toggles would have seen in real time.
Data note: draw history was pulled live from LottoIQ's own public API, the same source the game pages use. A retrieval limit meant this backtest covers the most recent 488 to 568 draws per game rather than each game's complete archive back to launch, real draws, a real sample, just not the full historical depth available on the live site. Treat the results as a large, honest sample rather than an exhaustive one.
The Results, By Dataset Window
Each table below compares Due Score's actual average matches per draw, what ranking by raw frequency alone would have produced, and the random baseline, the average matches you'd expect from picking with no method at all (pick-count squared divided by pool size). The random baseline doesn't change with the dataset window, it only depends on each game's pool size and pick count.
All-Time (expanding window)
| Game | Draws Tested | Due Score Avg | Frequency-Only Avg | Random Baseline |
|---|---|---|---|---|
| Lotto 6/49 | 488 | 0.734 | 0.721 | 0.735 |
| Lotto MAX | 515 | 0.924 | 1.000 | 0.942 |
| Lottario | 488 | 0.797 | 0.795 | 0.800 |
| Ontario 49 | 568 | 0.732 | 0.724 | 0.735 |
Last 90 (trailing window)
| Game | Draws Tested | Due Score Avg | Frequency-Only Avg | Random Baseline |
|---|---|---|---|---|
| Lotto 6/49 | 488 | 0.686 | 0.721 | 0.735 |
| Lotto MAX | 515 | 0.907 | 0.915 | 0.942 |
| Lottario | 488 | 0.793 | 0.855 | 0.800 |
| Ontario 49 | 568 | 0.783 | 0.757 | 0.735 |
Last 30 (trailing window)
| Game | Draws Tested | Due Score Avg | Frequency-Only Avg | Random Baseline |
|---|---|---|---|---|
| Lotto 6/49 | 488 | 0.699 | 0.686 | 0.735 |
| Lotto MAX | 515 | 0.955 | 0.930 | 0.942 |
| Lottario | 488 | 0.781 | 0.816 | 0.800 |
| Ontario 49 | 568 | 0.766 | 0.745 | 0.735 |
Match Distribution (All-Time)
Match-count distribution for Due Score's picks under the All-time window (percent of backtested draws landing at each match count):
| Matches | Lotto 6/49 | Lotto MAX | Lottario | Ontario 49 |
|---|---|---|---|---|
| 0 | 46.1% | 33.6% | 40.4% | 44.2% |
| 1 | 37.5% | 44.5% | 42.6% | 40.7% |
| 2 | 13.5% | 17.9% | 14.1% | 12.9% |
| 3 | 2.7% | 4.1% | 2.7% | 2.3% |
| 4 | 0.2% | 0.0% | 0.2% | 0.0% |
| 5+ | 0.0% | 0.0% | 0.0% | 0.0% |
What This Actually Shows
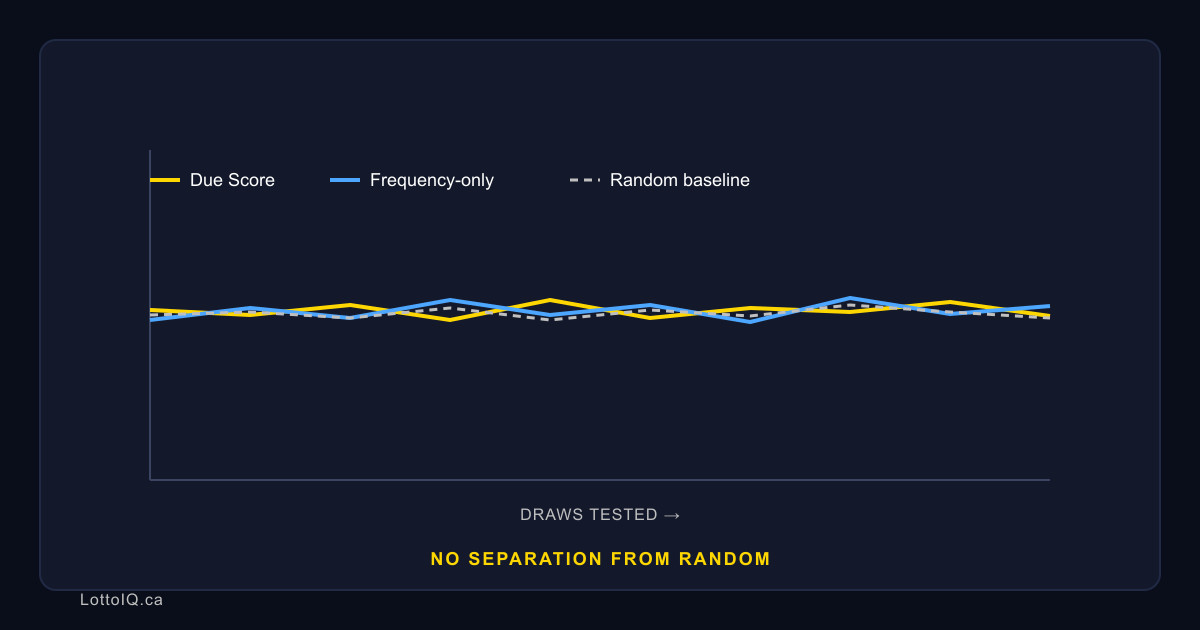
Across all three dataset windows and all four games, Due Score's average match count always lands within a few hundredths of the random baseline and never beats it consistently. Frequency-only ranking performs about the same as full Due Score too, sometimes edging ahead, sometimes behind, with no consistent direction, in Lotto MAX, frequency-only alone even edged ahead of Due Score under the All-time window (1.000 vs 0.924), while Due Score edged ahead of frequency-only under Last 30 (0.955 vs 0.930). That flip-flopping between which method looks marginally better, depending only on which window you happen to check, is itself a sign of noise, not a real edge in either direction.
Tightening the dataset to Last 30 or Last 90 doesn't produce an edge over All-time, or over each other, either. Every average across all three windows sits inside roughly the same noise band around each game's random baseline, for example, Lotto 6/49's Due Score average ranges from 0.686 to 0.734 depending on which window you check, against a baseline of 0.735. Whichever dataset window a member picks on the live site, the underlying math behaves the same way: no window length produces a real predictive edge, because none can, lottery draws are independent of each other regardless of how much or how little history you look back through.
This post is for informational and entertainment purposes only. LottoIQ does not predict lottery outcomes, and no statistical method changes the odds of any individual draw.