Features
What Watching Randomness Produce Hot Streaks Tells You (And What It Doesn't)
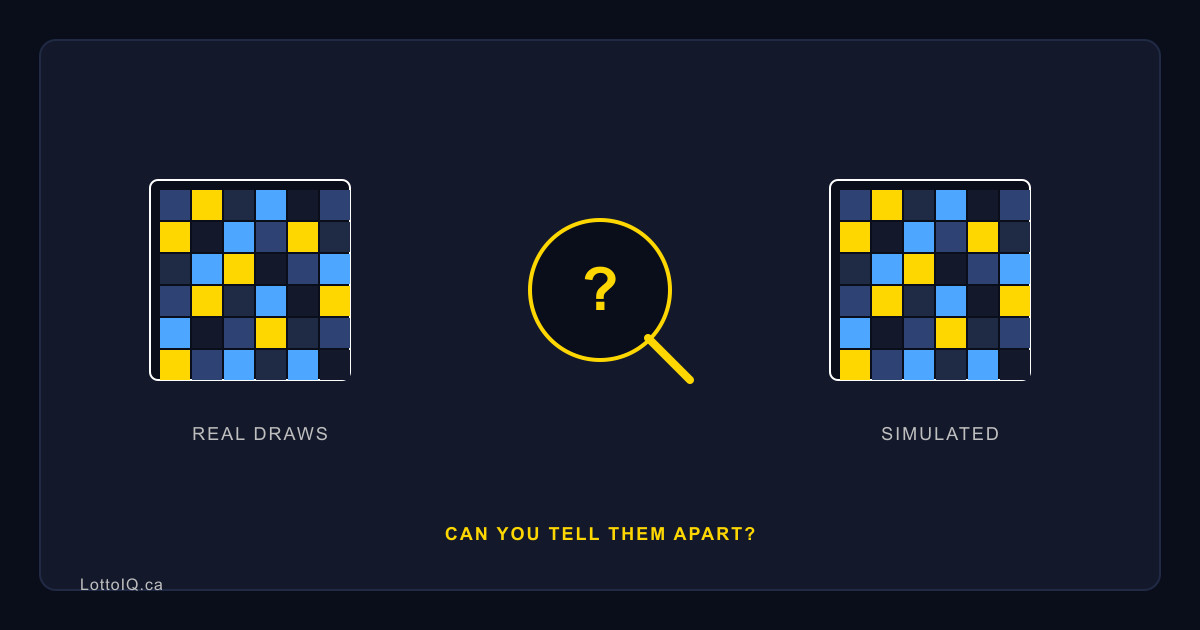
A closer look at one of LottoIQ's newest features.
You've probably looked at the Frequency Heatmap and noticed some numbers clustering together, hot streaks that seem too consistent to be an accident. It's a fair question: is that clustering meaningful, or is that just what randomness looks like over enough draws? The Randomness-in-Action Simulator is built to answer that, live, right in your browser, using numbers you generate yourself.
How it works
Pick one of the four built-in games and choose how many draws to simulate: 1,000, 5,000, or 10,000. Hit Simulate, and the page generates that many fake draws right there, using your browser's own random number generator. No real draw data is involved at any point.
To keep things smooth, the simulator runs in small batches so the page never freezes, with a live progress readout so you can watch it work. Once it's done, you'll see a frequency heatmap of the fake draws, using the same colour scale as the real heatmap, along with a chi-square randomness-audit card, the exact same statistical test used elsewhere on the site, just pointed at fake data this time.
What it's actually useful for
Run the simulator a few times and you'll see hot numbers, cold numbers, and clustering show up in the fake draws too, even though nothing but chance generated them. That's not because a game is biased or a number is due. It's simply what randomness looks like over any finite sample. There's also a Compare against real history toggle, which places the simulated heatmap and audit side by side with the game's real last-90-draw numbers, so you can see for yourself that fake and real data produce the same kind of pattern.
What it won't do
The simulator doesn't predict anything. It doesn't reveal a hidden trend, and it doesn't mean any number is due. It's a demonstration of what chance looks like, not a forecasting tool. Every real draw remains fully independent, no matter what any dataset, real or simulated, happens to show.
This feature exists so you can see the math for yourself, rather than take LottoIQ's word for it.
Member tip
Unlike the Heatmap's Insider-tier tip, this one applies to everyone: the simulator isn't split by membership level. Standard and Insider members get the exact same experience, every game, every draw count, no locks. Since results vary from run to run, it's worth trying more than one game and draw count to see how the patterns shift.
This post is for informational and entertainment purposes only. LottoIQ does not predict lottery outcomes, and no statistical method changes the odds of any individual draw.